
It’s clear that, thanks to unlimited data offers and the falling cost of the GB, wireless customers can now access more content on their phones at faster speeds than ever before. But what exactly are they doing on their phones, how much data are they chewing through, and which networks are they using to do it?
And perhaps most importantly, how does that break down across the customers of Verizon, AT&T, T-Mobile and Sprint?
A new partnership between FierceWireless and P3 aims to answer those questions. P3 is a global consulting, management and engineering services company, and it collects data on U.S. wireless usage via more than 6,000 participating smartphone users, with over 48 million samples from throughout the United States. The below information was obtained between January and August 2016.
For more information on P3, click here. And click here to check out P3's app.
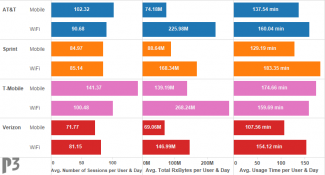
Analysis from P3: The chart shows the average of the number of app sessions per user and day, the total data volume spent per smartphone user and day, and the average time a user is actively using an app on the smartphone per user and day.
Users of all networks under consideration transmit more data on Wi-Fi compared to cellular; however, at the same time only T-Mobile users spend more time using apps on cellular compared to Wi-Fi while users of the other carriers show the opposite behavior. This may be attributed to T-Mobile’s aggressive Uncarrier moves, including Binge On, which doesn’t count specific applications against their high-speed data plans.
Verizon users show the fewest app sessions, lowest total data and least amount of usage time across all carriers; whereas T-Mobile users are the heaviest users across these categories.
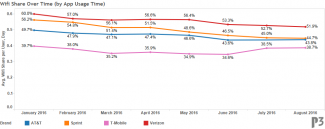
Analysis by P3: The chart shows the percentage of time smartphone users use any app on Wi-Fi over the course of the last eight months. The time-based Wi-Fi share is mostly declining over time across the four carriers under investigation, although T-Mobile continues to have the lowest Wi-Fi share, which again may likely be attributed to T-Mobile’s Uncarrier Bing On move.
Verizon users continue to rely on Wi-Fi for over half of their app usage time.
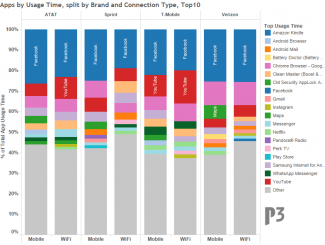
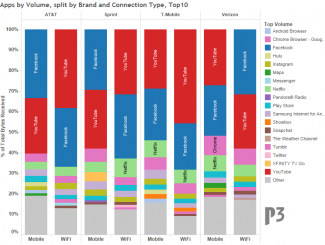
Analysis by P3: The charts show the most-used smartphone apps in the four national U.S. carriers ordered by the transmitted data volume and by the time users spent with the apps in both mobile and Wi-Fi.
Facebook and YouTube dominate the app usage stats for both data volume and usage time regardless of connection type.
Across all four carriers, users spend more time with Facebook on mobile than on Wi-Fi, yet not surprisingly, YouTube consumes a significant more amount of total data, which in turn leads the users to connect to Wi-Fi more often.
Related articles:
CTIA: Americans consumed 9.6 trillion MB of mobile data last year
Cisco: Mobile data traffic to increase 800% within 5 years
Report: LTE drives up mobile data consumption