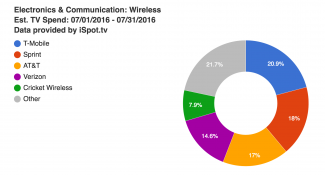
FierceWireless has partnered with TV advertising measurement firm iSpot.tv to bring you a monthly snapshot of the wireless industry's advertising spending and digital engagement. The results below are for the top five biggest spenders among wireless industry brands in July.

The wireless industry spent an estimated $199.1 million in July, almost exactly on par with spending for June ($199.8 million). T-Mobile jumped to the top of the chart from its previous fourth-place position, spending about $41.6 million during the month. Last month’s first-place holder AT&T dropped to third with an estimated $33.8 million, while Sprint held fast with an estimated $36 million. In total, 21 brands ran 104 spots 43,714 times, resulting in over 8 billion TV ad impressions.
Check out how these figures compare with May and June.
Here are the top 5 ads for July in terms of total spending:
1. T-Mobile spent about $41.6 million on 18 ads that ran 6,371 times and generated over 1 billion impressions. Its top ad, “T-Mobile’s Most Epic Deal Ever,” had an estimated spend of $15.9 million and aired 2,288 times for a resulting 387.4 million impressions. This commercial had the second highest spend overall in the wireless industry. In general, T-Mobile spent the most on ads that aired during America’s Got Talent, The Bachelorette and Spartan: Ultimate Team Challenge.
2. Sprint remained in second place with an estimated spend of $36 million on 7 ads that aired 8,189 times. Once again, “Paul Switched” was the brand’s top ad for the month, with a TV spend of about $17 million. This spot, which features the old Verizon “Can you hear me now?” spokesman Paul Marcarelli, aired 3,888 times and generated over 614 million impressions. For the second time in a row it was also the commercial with the most spend in the entire industry. Sprint spent heavily during America’s Got Talent, NASCAR races and Big Brother, and generated a total of 1.3 billion TV ad impressions.
3. Longtime frontrunner AT&T slipped to third place, representing 17 percent of the industry’s spend, which amounted to an estimated $33.8 million on 19 ads that ran 9,114 times. It spent the most ($13.9 million) on a commercial titled “Longest Fumble: Free Gear S2,” which aired 2,979 times and generated 524.2 million total impressions. AT&T spent heavily on ads running across NBC, ABC and E!, and on ones that aired during Keeping Up with the Kardashians, America’s Got Talent and Spartan: Ultimate Team Challenge.
4. Verizon claimed fourth place with an estimated spend of $28.9 million on 11 spots that ran 7,584 times and resulted in almost 1.1 billion impressions on TV. The brand spent about $8.9 million on “Not Studying,” a commercial featuring LeBron James that had 2,813 airings and 333.9 million impressions. Verizon spent the most on ads airing during the 2016 MLB All-Star Game, and also spent heavily during America’s Got Talent and Big Brother.
5. Cricket Wireless rounds out the chart, spending almost $15.7 million on 9 spots that ran 3,389 times. Its top ad was “The No-Duh-Uh-Huh Obvious Call,” which aired 814 times and generated 241 million impressions. It had an estimated spend of $10.2 million, about two-thirds of the brand’s total outlay. Overall, Cricket Wireless generated 547.9 million impressions and spent the most on commercials during the 2016 MLB All-Star Game, Big Brother and The Bachelorette.
iSpot's data does not include co-promotions or local market data. Click here for more on iSpot.tv's methodology.
The company's software leverages proprietary audio and video fingerprinting algorithms to automatically identify and extract TV commercials, movie trailers and show promos.
The company tracks hundreds of millions of explicit interactions with TV ads across roughly 100 million unique consumers. These interactions include video plays, searches and social activity. The company also analyzes online views across YouTube and iSpot.tv, searches on Google, Bing and Yahoo! and social activity on Facebook (including Facebook private views) and Twitter.
The company tags over 40 different dimensions of metadata, including brand, agency, actors, products, songs, moods, URLs and other pertinent data, to create its results.