
The second-quarter earnings season is coming to a close, so now it's time to see how the nation's top wireless carriers stacked up against each other in terms of key metrics.
In this report you will find a ranking of the of the top seven U.S. wireless carriers in the second quarter of 2016 by subscriber base, according to research firm Strategy Analytics. You'll also find charts of other major metrics -- such as churn, ARPU and revenue -- of each carrier. To see how these figures compare with the first quarter, click here.
Below that, Jackdaw Research analyst Jan Dawson provides several slides that offer an in-depth look at how Verizon, AT&T, Sprint and T-Mobile US each performed in the second quarter of 2016. Dawson's research dives into prepaid vs. postpaid performance, subscriber acquisitions vs. losses, and more.
So what are you waiting for? Dig in!
| Top US Wireless Carrier Metrics Q2 2016 (ranking by subscribers, retail + wholesale) | ||||||||
| Rank (# Subscribers) | Carrier | Subscribers (millions) | Net Adds (millions) | Postpaid Smartphone Net Adds (mil) | Blended Churn (Avg Monthly) | Service Revenue (US$ millions) |
Data % of Service Revenue | Blended Retail ARPU |
| 1 | Verizon Wireless | 142.754 | 1.285 | 0.336 | 1.19% | $16,741 | 57.3% | $47.07 |
| 2 | AT&T | 131.805 | 1.361 | 0.250 | 1.35% | $14,912 | 55.7% | $52.69 |
| 3 | T-Mobile USA | 67.384 | 1.881 | 0.877 | 2.22% | $6,888 | 59.0% | $42.60 |
| 4 | Sprint | 58.446 | -0.360 | 0.259 | 2.81% | $5,943 | $43.89 | |
| 5 | US Cellular | 4.979 | 0.053 | 0.071 | 1.69% | $762 | $45.77 | |
| 6 | C Spire* | |||||||
| 7 | Shentel | 1.007 | -0.008 | 0.007 | 2.04% | $115 | $49.07 | |
| Subscribers include retail and wholesale connections of both traditional and new connected device categories (e.g. M2M). Verizon Wireless subscribers include Strategy Analytics' estimates for wholesale and connected device volumes. Sprint subscribers and net adds exclude affiliate subscribers, but include wholesale. Blended Retail ARPU is derived from reported postpaid and prepaid retail/branded ARPU, unless reported separately by carrier. T-Mobile postpaid smartphone net adds, blended churn and blended ARPU are estimated or derived by Strategy Analytics *C-Spire is a private company and does not reveal its metrics, estimated to have c. 1.0 million subscribers. nTelos Q1 2016 figures estimated by Strategy Analytics. Source: Strategy Analytics, based on carrier reports |
||||||||
This list does not include resellers or MVNOs such as TracFone Wireless. (To see how TracFone did in the second quarter, click here.) You also might want to check out our wrap-up of the wireless industry in the second quarter of 2016.
Strategy Analytics also offered these insights into the wireless market:
And beyond these standard metrics, Dawson provides a deeper look. Thanks to a partnership between Dawson and FierceWireless, we're publishing these slides exclusively for a short time. These slides are part of a larger report Dawson has assembled on the first quarter. Dawson's quarterly slide deck, with about 40 charts, is available as part of a subscription service. In addition, he provides the underlying data behind the charts along with his analysis in custom presentations to certain clients, including carriers and device vendors. Dawson can be reached at [email protected] or (408) 744-6244.
Check out Dawson's first quarter slides and commentary below, and let us know what you think in the comments!
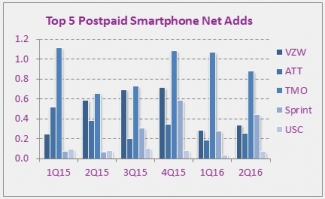
Postpaid phone net adds down at T-Mobile, up elsewhere
T-Mobile continues to lead the pack when it comes to net postpaid phone subscriber additions, with 646k in Q2 2016, compared with 173k for Sprint and even fewer for the other two major carriers. However, the other three carriers all did better in Q2 compared to Q1, while T-Mobile's phone net adds fell considerably. In fact, this was the fourth quarter in a row in which T-Mobile added fewer postpaid phone subscribers than a year earlier. Its momentum seems to be slowing fairly consistently at this point, raising again the question of whether it can sustain its long-term growth trajectory. Thankfully, it's doing well in prepaid subscriber growth recently too, which is helping to keep overall net adds strong.
Share gains have been modest
T-Mobile is also still gaining share, though only in modest amounts. The chart below shows the share of calculated postpaid gross adds for each of the major carriers in Q2 2015 and Q2 2016. As you can see, T-Mobile gained a little over one point of share during that time, taking share from both AT&T and Verizon, while Sprint's share of gross adds remained fairly constant (and the lowest by far of the big four). This tracks reasonably well with T-Mobile's reported porting ratios, which show the carrier taking share largely from AT&T and Verizon and much less so from Sprint. Sprint, for its part, reported positive porting ratios against T-Mobile this quarter, although T-Mobile's numbers show something different. At any rate, it's fairly clear that Sprint is starting to hold its own share-wise, while Verizon and AT&T continue to be the main targets for both of the smaller carriers.
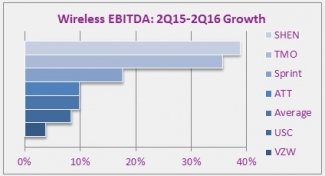
ABPU starting to improve for all carriers
Since the introduction of equipment installment plans and leasing over the last few years, the major carriers have moved from reporting average (service) revenue per user (ARPU) to reporting average billings per user. Since the economics of installment billing work differently from the old subsidy model, this caused both ARPU and ABPU declines for the carriers as they underwent this transition. However, it now appears that the carriers are all far enough along in the transition to start to see stabilizing and even rising ABPU, as shown in the chart below. AT&T and T-Mobile have seen rising ABPU for some time now, as T-Mobile was the first carrier to make this move, and AT&T effectively ripped off the revenue dip Band-Aid in early 2014. Sprint and Verizon, though, have taken longer to reach this point, though both now appeared to have turned a corner in the last couple of quarters. This should now lead to rising revenues as well.
Upgrade rates continue to fall across the board
For smartphone vendors, the bad news is that both upgrade rates and smartphone penetration rates are slowing. This quarter, upgrade rates were down year on year for all four carriers, and in several cases are now at multi-year lows. The first chart below shows quarterly postpaid device upgrade rates for all four major carriers, and as you can see, the light blue lines representing 2016 numbers are below not just the 2015 numbers but in some cases below 2014 and even 2013 too. In the second chart below, you can see the smartphone penetration rate across the four major carriers, in addition to the growth in that rate, which has been tapering off as the market reaches saturation. There has been no increase in the percentage of phone sales accounted for by smartphones in the last couple of quarters, and we're now seeing that translate into a slowing penetration rate in the base as well. The slowing upgrade rate and increasing saturation are the two causes of the decline in smartphone sales in the US over the past few quarters, and there's no reason to think that this is going to get better any time soon.